#25 Weekly Update - He Did It - How Will It Impact The Market?
No! We are not on the brink of WWIII
Hi and welcome back for a Quant data driven analysis. [Full Disclaimer]
Coming up this week: Quarterly Portfolio Upgrades
Let's dive in and make some smart moves! 💰🚀
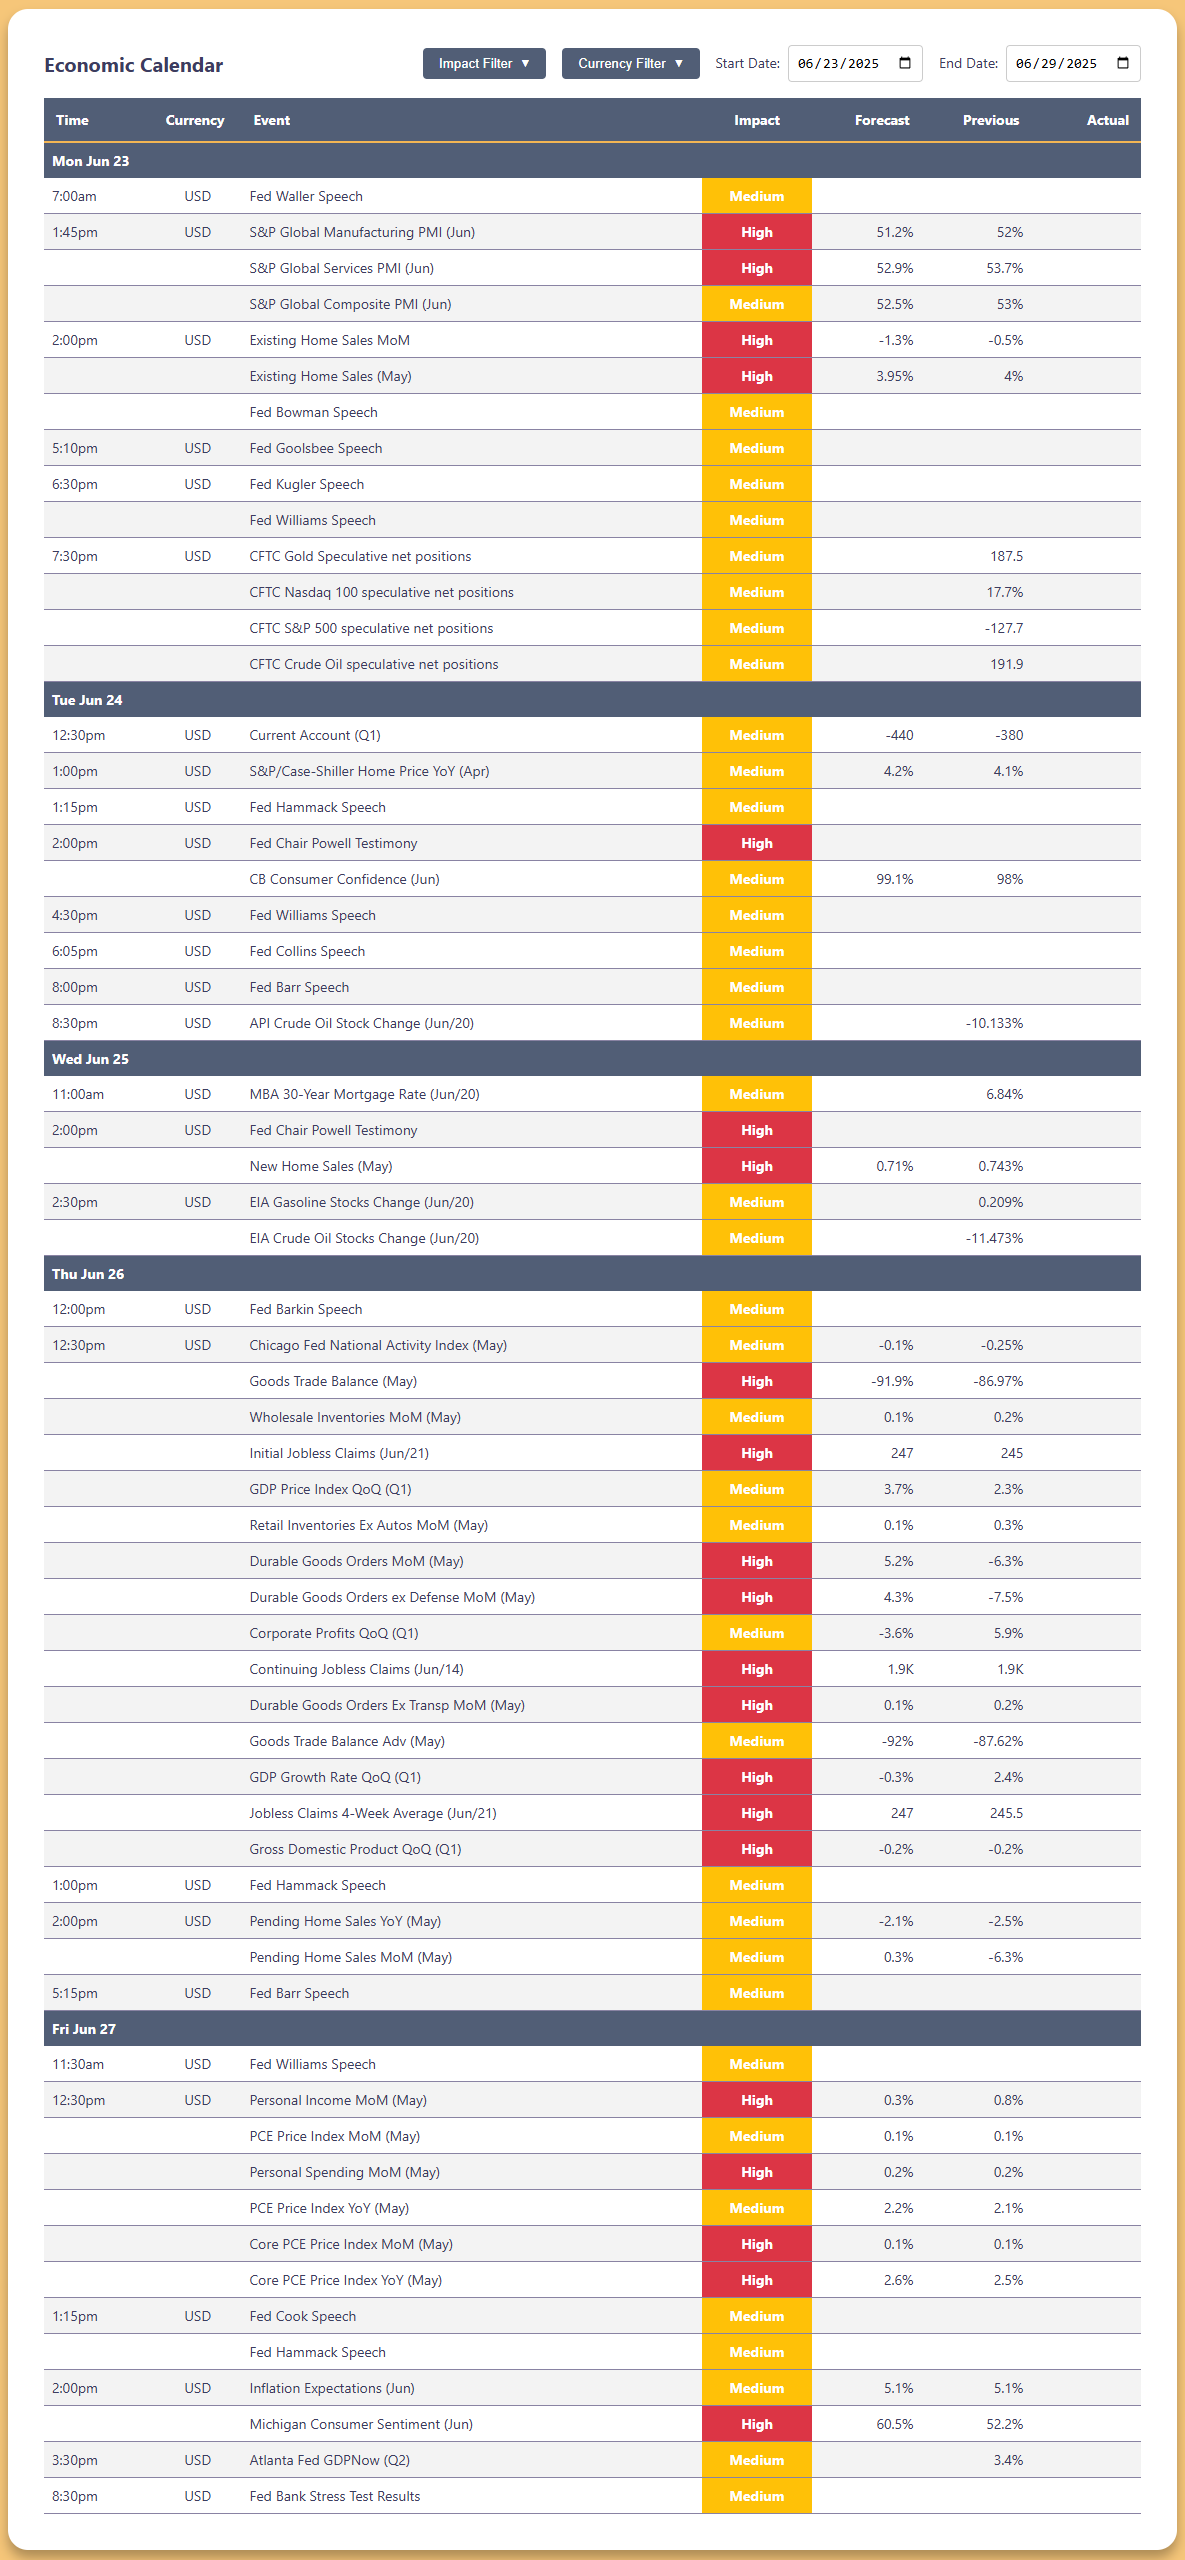
📅Week Calendar June 23-29, 2025
High Impact Events
Monday June 23
S&P Global Manufacturing PMI (Jun): Forecast 51.2%, Actual 52%
S&P Global Services PMI (Jun): Forecast 52.9%, Actual 53.7%
Existing Home Sales MoM: Forecast -1.3%, Actual -0.5%
Existing Home Sales (May): Forecast 3.95%, Actual 4%
Tuesday June 24
Fed Chair Powell Testimony: High Impact
Wednesday June 25
Fed Chair Powell Testimony: High Impact
New Home Sales (May): Forecast 0.71%, Actual 0.743%
Thursday June 26
Goods Trade Balance (May): Forecast -91.9%, Actual -86.97%
Initial Jobless Claims (Jun/21): Forecast 247, Actual 245
Durable Goods Orders MoM (May): Forecast 5.2%, Actual -6.3%
Durable Goods Orders ex Defense MoM (May): Forecast 4.3%, Actual -7.5%
Continuing Jobless Claims (Jun/14): Forecast 1.9K, Actual 1.9K
Durable Goods Orders Ex Transp MoM (May): Forecast 0.1%, Actual 0.2%
GDP Growth Rate QoQ (Q1): Forecast -0.3%, Actual 2.4%
Jobless Claims 4-Week Average (Jun/21): Forecast 247, Actual 245.5
Gross Domestic Product QoQ (Q1): Forecast -0.2%, Actual -0.2%
Friday June 27
Personal Income MoM (May): Forecast 0.3%, Actual 0.8%
Personal Spending MoM (May): Forecast 0.2%, Actual 0.2%
Core PCE Price Index MoM (May): Forecast 0.1%, Actual 0.1%
Core PCE Price Index YoY (May): Forecast 2.6%, Actual 2.5%
Michigan Consumer Sentiment (Jun): Forecast 60.5%, Actual 52.2%
Notable Market Data Points
API Crude Oil Stock Change (Jun/20): -10.133%
EIA Crude Oil Stocks Change (Jun/20): -11.473%
EIA Gasoline Stocks Change (Jun/20): 0.209%
Goods Trade Balance Adv (May): -87.62%
The economic calendar for June 23-27, 2025 shows numerous high-impact events with significant Fed activity including multiple speeches by Fed officials and Chair Powell's testimony. Market-moving economic releases include housing data, GDP figures, durable goods orders, and inflation indicators (particularly PCE data on Friday).
Last Week Recap:
Market Narrative: The Unprecedented Escalation
Based on the confirmed intelligence, the US struck three Iranian nuclear facilities - Fordow, Natanz, and Isfahan - using 14 bunker-buster bombs and over 30 Tomahawk missiles. This isn't speculation - it happened yesterday, and the market implications are profound.
Here's what the numbers tell us about the coming weeks:
Oil Market Reality Check
Brent crude is expected to gain $3-5 per barrel when markets reopen Sunday evening, but that's just the opening act. Brent crude, already up 20% over the past month to $79.04, could climb toward $130 per barrel in a worst-case scenario, according to JPMorgan.
The fundamentals are stark:
Iran is the third-largest producer among OPEC members, extracting about 3.3 million barrels per day.
About 18 million to 21 million bpd of oil and oil products move through the Strait of Hormuz - that's 20% of global oil flow
Currently stable supply conditions and the availability of spare production capacity among other OPEC members have limited oil's gains, but that cushion is thin
Equity Market Patterns: History as Our Guide
The S&P 500 reaction follows a predictable pattern from previous Middle East conflicts. On average, the S&P 500 slipped 0.3% in the three weeks following the start of conflict, but was 2.3% higher on average two months following the conflict, according to data from Wedbush Securities and CapIQ Pro.
But this time feels different. During past eruptions of Middle East tensions, including the 2003 Iraq invasion and the 2019 attacks on Saudi oil facilities, stocks initially languished but soon recovered to trade higher in the months ahead. The key difference: direct US military involvement against a major oil producer.
🔐Premium Member only.🔐
Disclaimer: This article is for informational purposes only and does not constitute investment advice. Always do your own research and consider your financial situation before making investment decisions.


