


Tested Portfolio to Grow With Your Kids into adulthood better than S&P 500!
Long term and Outperforming the SPY!

Here you have another Back-tested Portfolio Strategy Outperforming S&P 500!
Not to miss my A to Z TradingView Masterclass if you haven’t check it out yet
Combined Portfolio Strategy: Show Me the Money
Combined Portfolio Strategy, which incorporates multiple assets: SharedData, VUG, SMH, and GLD. We'll examine its performance from 2015 to 2024, focusing on risk-adjusted returns, drawdowns, and overall portfolio efficiency.
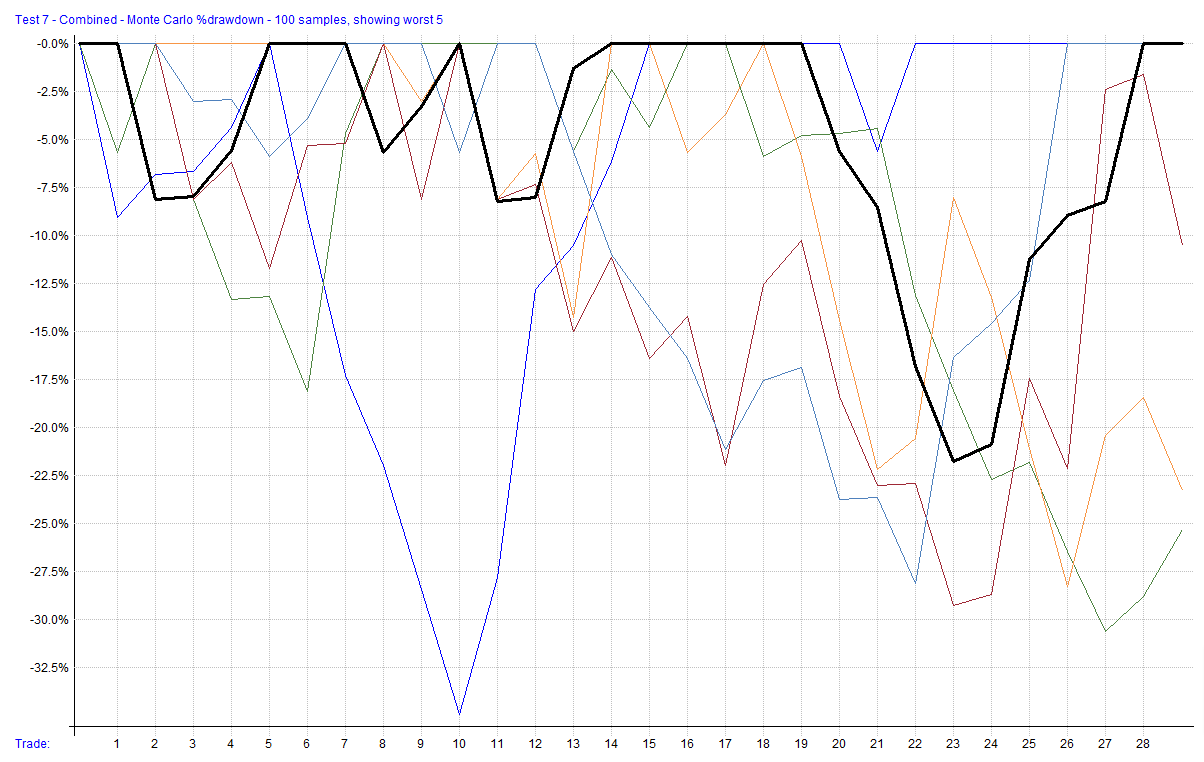
The Monte Carlo analysis provides crucial insights into the strategy's robustness and risk profile:
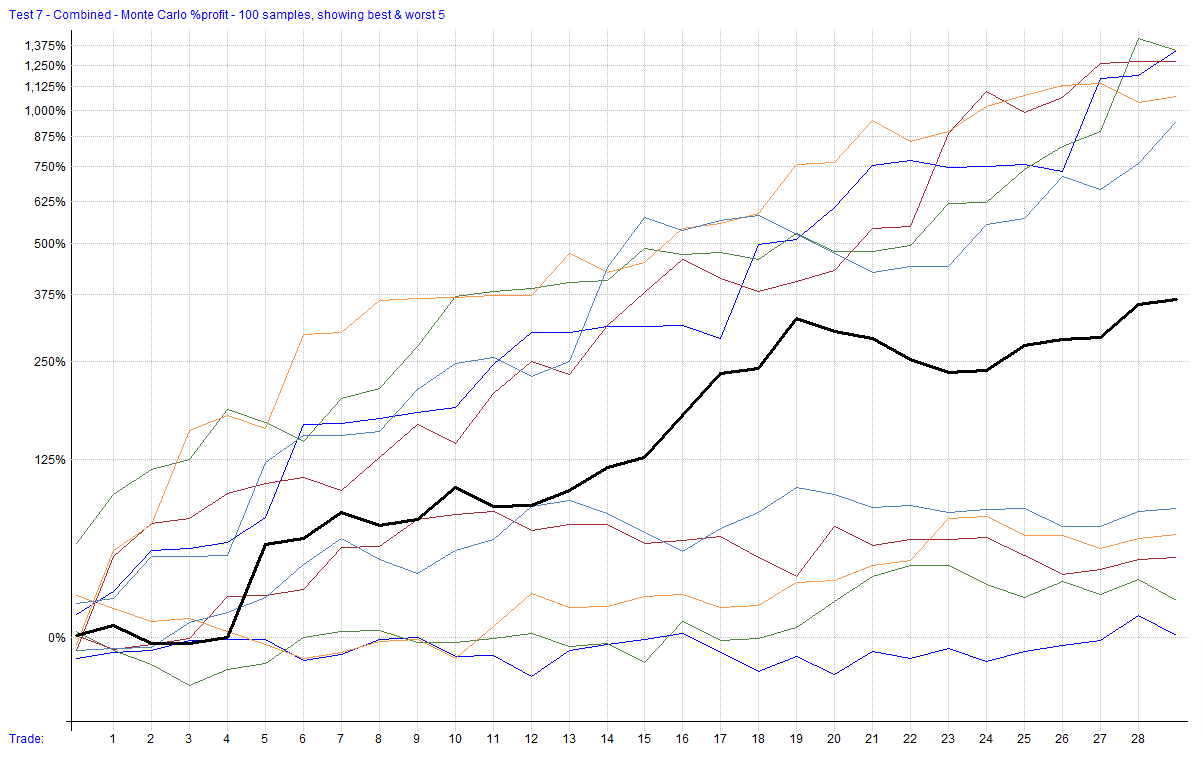
Net Profit Range: 18.51% (1st percentile) to 1,360.59% (99th percentile)
Median Net Profit: 315.49% (50th percentile)
CAR Range: 1.79% to 32.38%
Max Drawdown Range: -34.76% to -3.07%
Key observations:
Wide profit range indicates high variability in outcomes
Median profit (315.49%) suggests overall positive performance
Worst-case scenario still yields positive returns (18.51%)
Maximum drawdown in worst case (-34.76%) is significant but not catastrophic
The profit distribution shows a right-skewed pattern, indicating potential for outsized gains in favorable scenarios.
2. Portfolio Composition and Performance
The portfolio consists of four components: SharedData, VUG, SMH, and GLD.
Summary Stats:

Key insights:
SMH is the primary driver of returns
GLD provides diversification benefits
VUG contributes modest returns with lower volatility
SharedData's role is unclear from the provided data
3. Correlation Analysis

Keep reading with a 7-day free trial
Subscribe to Eltoro Market Insights to keep reading this post and get 7 days of free access to the full post archives.