Stan's Fortress MOAT of Midas Touch #5 - Outdoing SPX +200% - 54 Strong Against any Winter
⭐⭐⭐⭐⭐ - Stan's Fortress MMT#5: 54 Strong Together - ☢️⚪⚪⚪⚪
Discover how I use one of the world's most esteemed investors to shape MMT #5 portfolio and what it means for you.
Stanley Druckenmiller is a name synonymous with investment success. With a career spanning several decades, he's renowned for his exceptional expertise and consistent returns. Now, through the Remastered Stan's Fortress MOAT of Midas Touch #5 Portfolio, investors have a unique opportunity to glimpse into his strategic mastery.
I'll break down the components of this MMT portfolio, explore its impressive performance metrics, and uncover actionable insights that could enhance your investment journey.
Decoding Stan's Fortress MOAT Portfolio: Insights and Opportunities
Stellar Portfolio Performance
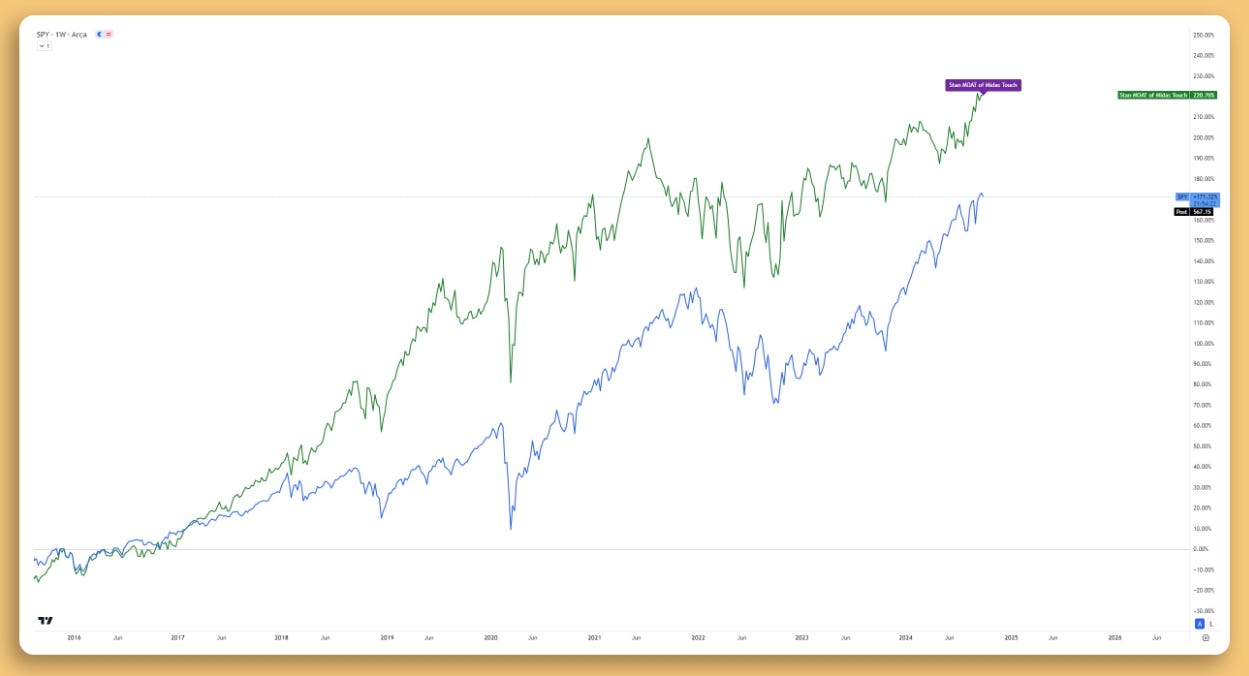
Impressive Returns That Outshine the Market
September Performance: +7.88%
Year to Date (YTD): +54.18%
1-Year Return: +71.85%
5-Year Return: +67.37% (annualized over 7.4 years)
Annualized Return: +60.87%
These figures aren't just numbers—they represent a track record of outperforming the broader market, including the S&P 500. The portfolio's 7.4-year track record showcases a consistent upward trajectory, signaling robust investment strategies.
Who's Behind Shield MMT Portfolio
Investment Intelligence is the brain behind the Remastered Stan's Fortress MOAT of Midas Touch #5 Portfolio. Founded by experts with decades of experience in asset management and market analysis, their mission is clear: to add value for investors through insightful analysis, advanced tools, and well-curated portfolios. Our approach is independent and investor-focused, ensuring that the strategies align with long-term growth objectives.
Risk and Reward Balance
Moderate Risk with High Returns
Risk Score: 5
A risk score of 5 indicates a balanced approach. The portfolio manages to achieve high returns without venturing into high-risk territories, making it suitable for investors seeking growth with controlled risk exposure.
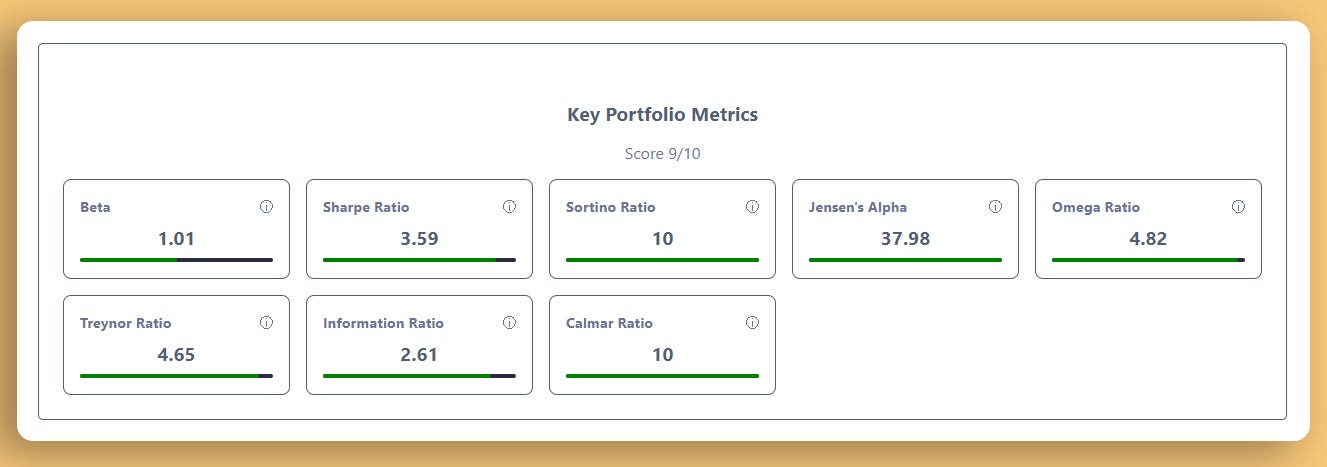
These metrics collectively highlight a portfolio that's not only performing exceptionally but is also efficiently managing risk.
Deep Dive into Performance Metrics
Understanding the portfolio's success requires a look at key performance metrics:


