Portfolio Strategy that Outperform SPX!
Outperforming the SPY!
But first, starting next week! Don’t miss my A to Z TradingView lessons.
Show Me the Money
The Strategy significantly outperforms the S&P500 (SPY) benchmark in terms of net profit, generating $3,423,884 compared to $1,401,021. This represents a 144% increase in profitability over the benchmark. The strategy's higher ROR (12.31% vs. 8.99%) indicates better risk-adjusted returns.
The Big Picture: How Did It Perform?
I’ve tested hundreds of strategies in the past. Simplicity wins the race!
Total Profit: The strategy made $3,423,884, while simply investing in the S&P 500 (SPY) would have made $1,401,021. That's like turning your $100,000 into over $3.5 million instead of just $1.5 million!
Return on Risk: This strategy earned 12.31% for every unit of risk taken, compared to 8.99% for the S&P 500. It's like getting more bang for your buck.
Maximum Drawdown: The biggest drop was 30.79%, while the S&P 500 dropped as much as 47.03%. Imagine a set back of only a third of your money in the worst case, instead of nearly half.
MAR Ratio: At 0.40 vs. 0.19 for the S&P 500, this shows the strategy makes more money for the risks it takes.
Sharpe Ratio: 0.69 vs. 0.63 – a bit higher, meaning it's slightly better at balancing risk and reward.
Trading Breakdown
Made 507 trades over the years
Won 74.56% of the time (pretty impressive!)
Average win was 1.02%, while average loss was 1.51%
For every dollar risked, it made $1.64 (that's the Profit Factor of 1.64)
Digging Deeper: What Makes It Special?
1. Profitability: Beating the Market
Our strategy is like a sports car that's lapped the regular sedan (the S&P 500) twice. It's not just winning; it's winning by a lot.
2. Playing It Safe: Managing Risks
This strategy is like a cautious driver with great reflexes. When the market gets rocky:
Lower Maximum Drawdown: It loses less money (30.79% max drop vs. 47.03% for S&P 500)
Higher MAR Ratio: It recovers faster 0.40 vs. 0.19, indicating better risk-adjusted performance
Improved Sharpe Ratio: It provides a smoother ride overall 0.69 vs. 0.63, suggesting better risk-adjusted returns
The secret sauce? That tight stop-loss we mentioned earlier use of a tight stop-loss (0.1%) contributes to this improved risk profile.
3. Smart Trading: Quality Over Quantity
Trade Characteristics
Wins 3 out of 4 trades (74.56% win rate)
Keeps losses close to the size of wins (1.51% loss vs. 1.02% win on average)
Each trade is expected to make 0.38% on average
Solid Profit Factor: 1.64, indicating good overall profitability
You don’t need to always hit home runs but consistently gets on base.
4. Year by Year: The Long Game
Looking at the monthly performance, analyzing the combined conthly cercent cains table:
Best year: 2021 with a whopping 58.5% return
Toughest year: 2018 with a 16.2% loss
Consistency: Strategy shows positive returns in most years, with occasional down years
It's not always smooth sailing, but the good years more than make up for the bad ones.
5. Weathering Storms: Drawdown Analysis
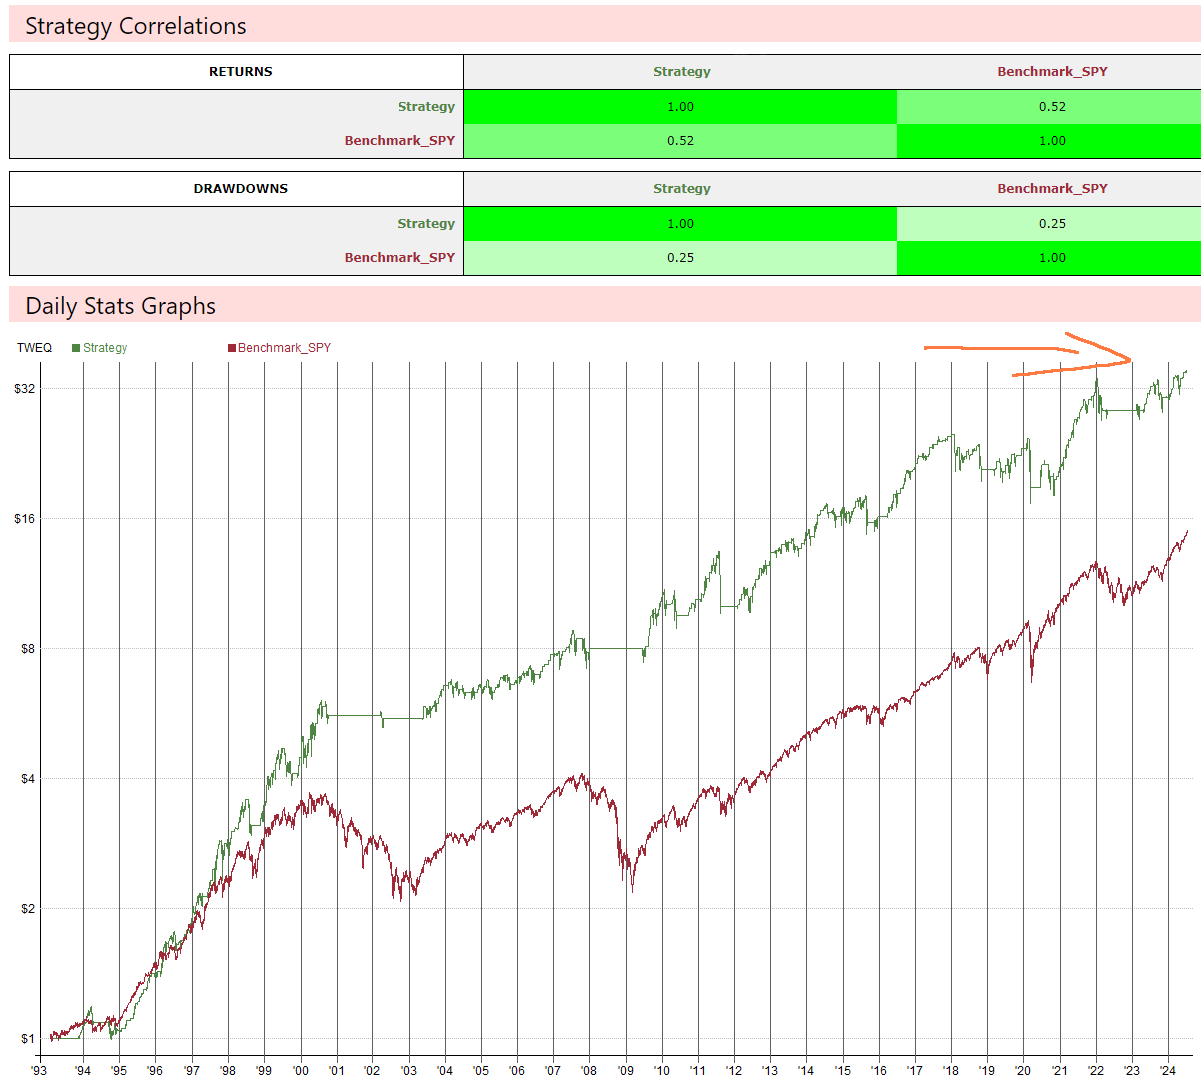
Our strategy's boat (the green line) rides the waves better than the S&P 500's boat (the red line). It doesn't dip as low and recovers faster when big waves hit.
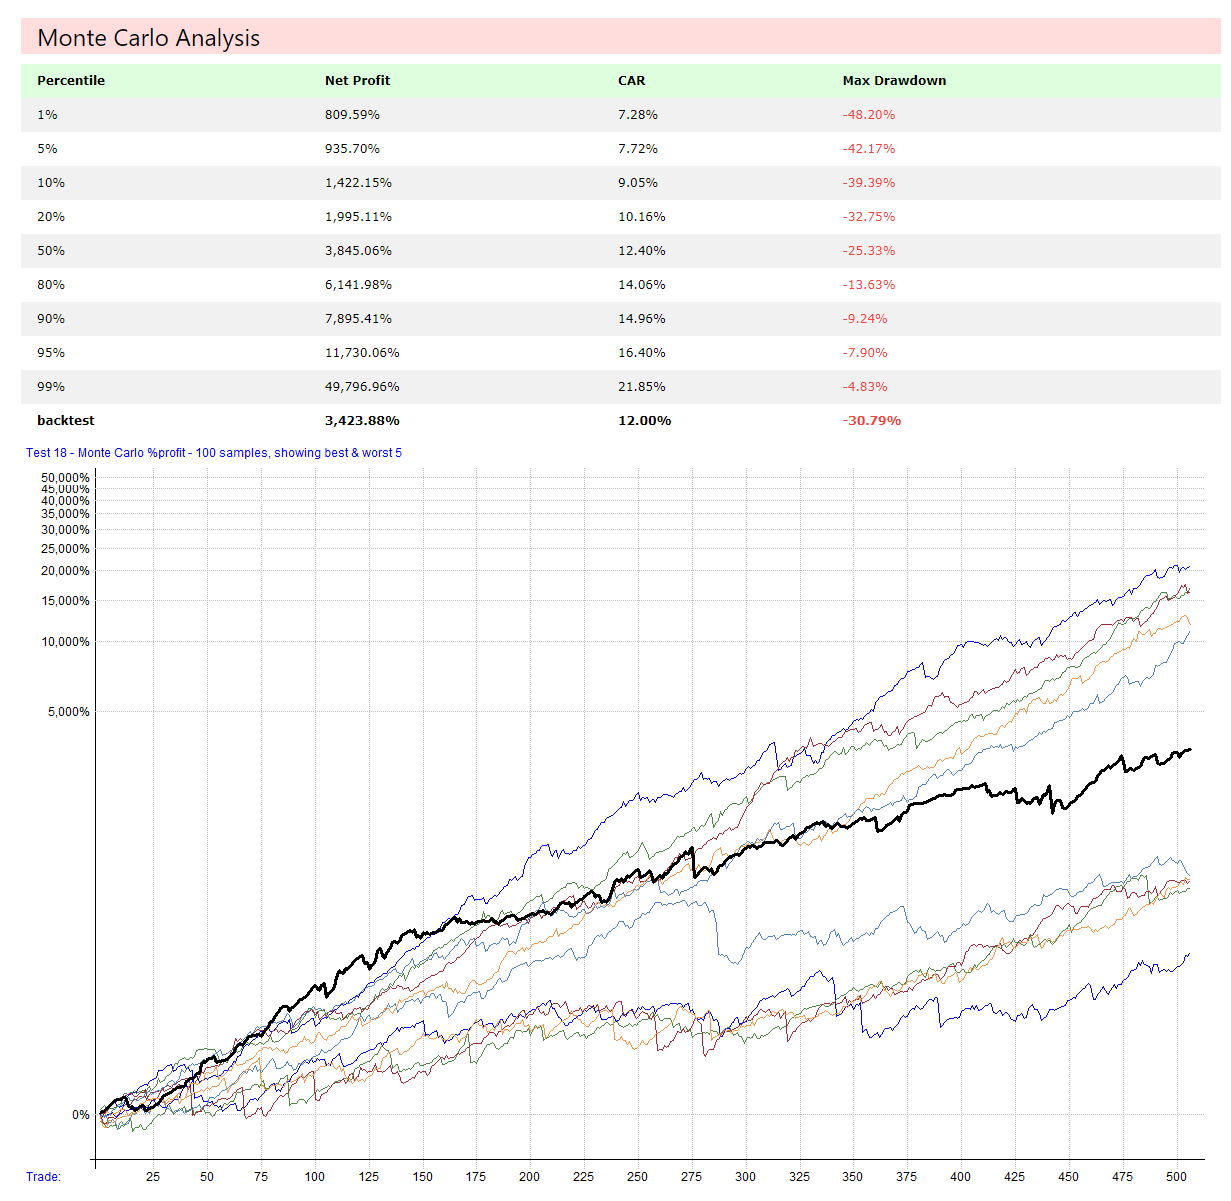
The Monte Carlo simulation provides insight into the strategy's robustness:
Median Net Profit: 3,845.06% (50th percentile)
Worst-Case Scenario: 809.59% profit (1st percentile)
Best-Case Scenario: 49,796.96% profit (99th percentile)
This analysis suggests that the strategy is likely to remain profitable across various market conditions.
6. What If? Monte Carlo Analysis
This is like running thousands of simulations to see how the strategy might perform in different scenarios:
In the middle-of-the-road scenario, it turns $100,000 into about $3.8 million
Median Net Profit: 3,845.06% (50th percentile)
In the worst-case scenario, it still makes about $800,000
Worst-Case Scenario: 809.59% profit (1st percentile)
In the best-case scenario, it could make nearly $50 million!
Best-Case Scenario: 49,796.96% profit (99th percentile)
This shows that even if things don't go perfectly, the strategy is to be profitable.
The Bottom Line
This Strategy rides the waves of the market better than most. It makes more money, loses less in bad times, and provides a smoother ride overall compared to simply investing in the S&P 500.
Key Takeaways:
It's significantly more profitable than just buying and holding the S&P 500
It protects your money better when markets go down
It performs consistently well in various market conditions
But remember:
It uses leverage, borrowing money to invest more. This can amplify both gains and losses.
Past performance doesn't guarantee future results. The market can always throw curveballs.
It might lag behind in certain market conditions, especially when there are sudden reversals.
In essence, this offers a compelling way to potentially grow your wealth faster than the overall market, with some added protection against big losses. As with any investment strategy, it's crucial to understand the risks and keep a close eye on performance. This demonstrates superior performance compared to the SPY benchmark, offering higher returns with better risk management. Its combination of trend-following (using moving averages) and risk control (tight stop-loss) proves effective in capturing market trends while protecting capital.
Remember what goes up must come down (eventually)
Stay safe and invest wisely and this is in no mean financial advice.Harry


