


5 Rules to Survive Market Mayhem - Practical Mid-Term Risk Management
More efficient Mid-Term "How Not To Lose". Keeping Losers low and Winners high

Hi and welcome back for a Quant data driven analysis. [Full Disclaimer]

Remember, opportunities like this come around rarely. This is your chance to unlock tools and insights that can genuinely transform your investment outcomes.

Managing Risks for Less Than a Year
Mid-term investing, defined as a horizon of less than one year, demands a careful balance between protecting capital and seizing opportunities. Success hinges on rapid analysis, disciplined execution, and a robust risk management framework (RMF). Below is a guide tailored to mid-term investors, offering actionable strategies to navigate volatile markets effectively.
Understanding Mid-Term Investment Landscape
Mid-term investing is characterized by heightened sensitivity to market fluctuations and limited recovery time. Events like earnings reports, geopolitical developments, or policy changes can trigger sharp price movements. For instance, while annualized S&P 500 volatility averages 15%, weekly volatility can spike to 5% or more during turbulent periods.
To navigate this environment:
Track Technical Indicators: Use tools like moving averages (20-day and 50-day), Relative Strength Index (RSI), and Average True Range (ATR) to identify trends and reversals.
Monitor Volatility: Actively track drawdowns and position sizes.
Adapt to Market Dynamics: Stay alert to sector rotations, liquidity shifts, and changing correlations between asset classes. For example, during market stress, equities may show negative correlations with safe-haven assets like Treasuries.
Building a Risk Management Framework

A robust RMF ensures every decision aligns with predefined rules. It involves three phases: pre-trade planning, execution with tactical stops, and ongoing monitoring.
1. Define Risk Tolerance
Set clear loss limits early. For mid-term investors:
Maximum drawdown: 7–10%.
Use tools like the Sharpe ratio for risk-adjusted returns and beta for portfolio sensitivity.
Example: A portfolio with a beta of 1.2 could drop by 1.2% if the market declines by 1%.
2. Position Sizing
Limit individual trade risks to no more than 2% of total capital. For a $100,000 portfolio:
Risk per trade = $2,000.
Use ATR-based calculations to determine position sizes dynamically.

3. Diversify Strategically
Diversification reduces risk by spreading exposure across low-correlation asset classes:
Example allocation: 60% equities, 40% fixed income.
Include low-volatility ETFs, short-term Treasuries (yielding 4–6%), or money market funds.

Portfolio volatility can be estimated as:
Key Risk Metrics
Maximum Drawdown (MD)
Measures peak-to-trough losses; aim for MD below 10%. Example: A $100,000 portfolio dropping to $90,000 reflects a 10% drawdown.
Beta and Alpha
Beta: Measures portfolio sensitivity; values near or below 1 are ideal.
Alpha: Indicates performance beyond expectations based on beta; positive alpha reflects outperformance.
Sharpe and Sortino Ratios
Sharpe Ratio: Evaluates excess returns relative to volatility; aim for values above 1.
Sortino Ratio: Focuses solely on downside risk.
ATR-Based Stop-Losses
Set stop-loss levels using ATR multiples (e.g., 1.5–2× ATR). Example:
If ATR indicates an average daily move of 3%, set stop-losses at ~4.5%.
Tactical Tools for Hedging
Even well-designed portfolios benefit from tactical tools:
Stop-Loss Orders: Predefined exit points limit losses during downturns.
Options Hedging: Protective puts act as insurance against declines.
Leverage Control: Limit leverage ratios to avoid overexposure (e.g., no more than 1:2 or up to 1:3 in specific cases).

Active Monitoring and Adjustments
Real-time vigilance ensures alignment with risk objectives:
Monitor daily/weekly ATR values for intensifying price swings.
Set daily Value at Risk (VaR) thresholds (e.g., ≤5%) to cap potential losses.
Rebalance allocations when deviations exceed target ranges by more than 5%.
Case Study: Practical Application
Jane invests $200,000 over nine months using the following strategy:
Allocation:
50% equities (target beta ~0.9).
30% short-duration bonds.
10% low-volatility ETFs.
10% options hedges.
Risk per trade = $4,000 (2% of total capital).
Stop-losses set at ATR-based levels.
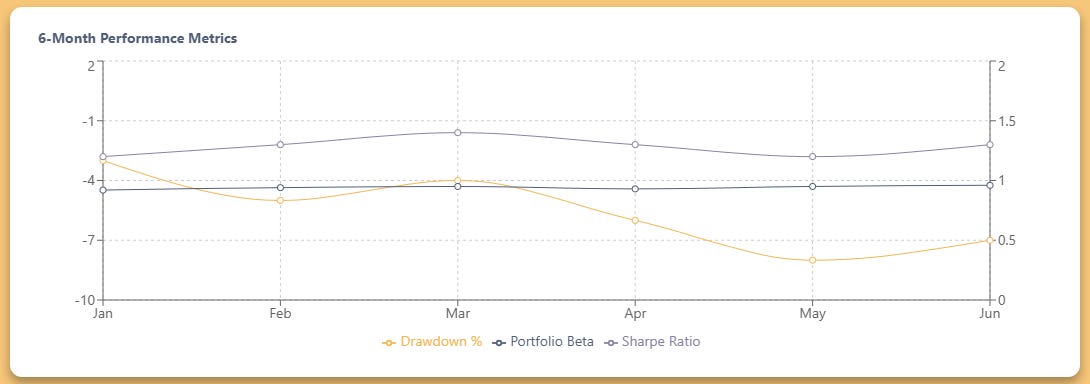
Results after six months:
Portfolio beta remains ~0.95.
Sharpe ratio averages ~1.3.
Maximum drawdown stays within an acceptable range of 8%.
Automated alerts ensure timely rebalancing when metrics deviate from targets.
Leveraging Technology and Behavioral Discipline
Modern tools enhance risk management:
Platforms like Yahoo Finance provide live dashboards integrating ATR, beta, and VaR metrics.
Algorithmic trading systems adjust positions based on live signals.
Behavioral discipline is equally important:
Rules-based strategies counteract emotional decisions during market turbulence.
Continuous Improvement
Post-trade analysis refines strategies by reviewing metrics like realized versus implied volatility or hedging effectiveness.
Final Checklist for Mid-Term Investors
Define Risk Metrics:
Maximum drawdown ≤10%.
Trade risk ≤2%.
ATR-based stop-losses at 1.5–2× ATR.
Target Sharpe ratio ≥1.
Diversify:
Blend equities, bonds, ETFs, and hedges.
Maintain correlation below 0.5.
Use Tactical Tools:
Stop-losses/trailing stops.
Options hedging.
Monitor Regularly:
Weekly reviews of beta, Sharpe ratio, VaR.
Rebalance when deviations exceed thresholds.
By adhering to these principles—combining quantitative rigor with behavioral discipline—you can safeguard capital while navigating volatile markets effectively within a one-year horizon.
Bottom Line
mid-term investors have unique challenges, but by strictly adhering to a disciplined framework and continuous monitoring, you can safeguard your capital while still seizing opportunities in volatile markets. Remember, the key lies in clear metrics: precise stop-loss levels, careful allocation, and automated systems that act swiftly when market conditions change. Whether you’re managing a$100,000 portfolio or deploying several hundred thousand dollars, the principles remain the same.
By embracing both quantitative measures and qualitative discipline, you position yourself not only to survive short-term market swings but to thrive amid them. Your strategy becomes a living blueprint—one that evolves with every market move and turns uncertainty into opportunity.
May your investments be guided by sharp analysis, robust risk controls, and the relentless pursuit of capital preservation paired with measured growth. With these tools and insights at your disposal, mid-term investing becomes not a series of guesswork, but a methodical process where every metric informs a calculated decision, and every decision protects your hard-earned capital.
Disclaimer: This article is for informational purposes only and does not constitute investment advice. Always do your own research and consider your financial situation before making investment decisions.
Remember what goes up must come down (eventually)
Stay safe and invest wisely and this is in no mean financial advice. [Full Disclaimer]Thank you for supporting this newsletter. It will keep improving.
Harry