Four giants stand tall, captivating the attention of traders and investors alike. In this analysis, I look into the intricate technical landscapes of NVIDIA, AMD, Tesla, and Apple, unveiling the patterns, trends, and potential scenarios that shape their market trajectories.
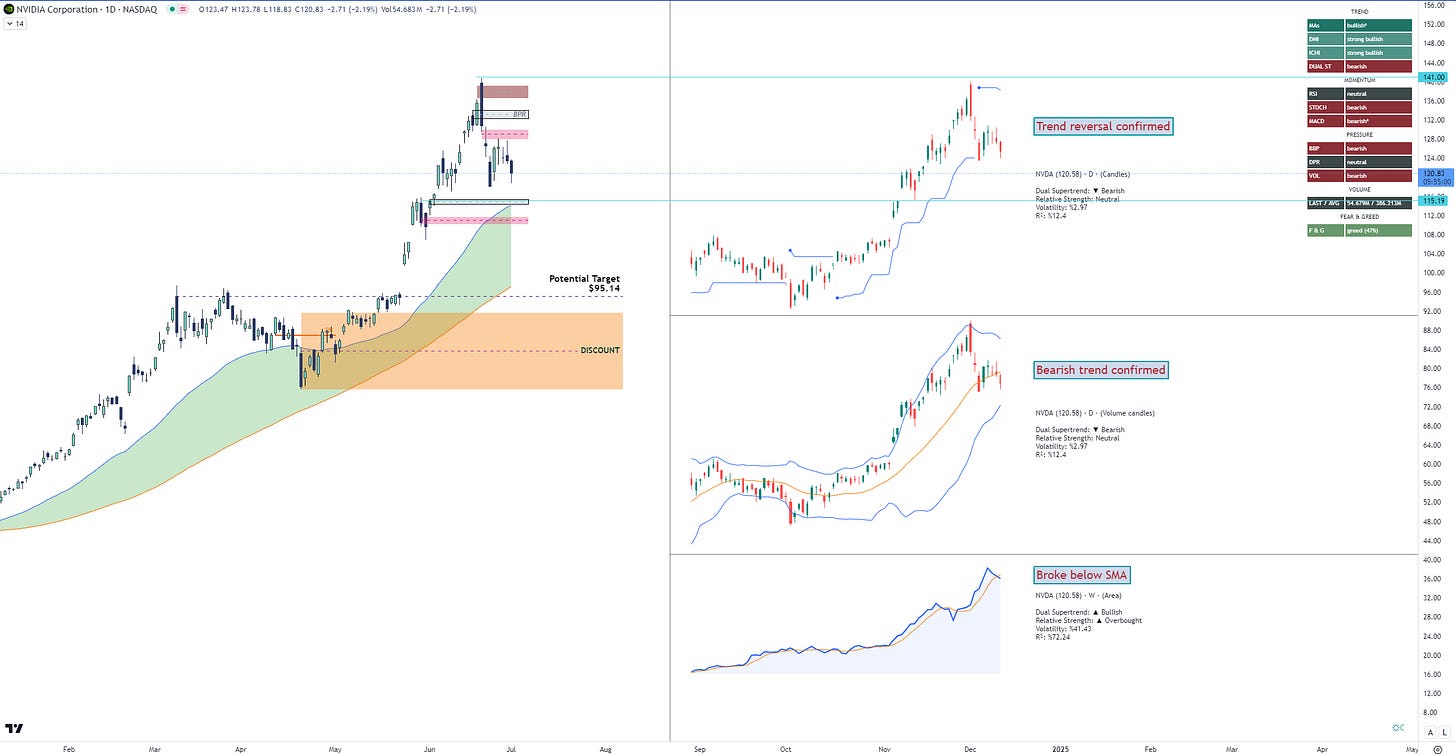
NVIDIA Corporation (NVDA) - NASDAQ
Bullish Narrative Unfolds
NVIDIA's chart paints a compelling bullish narrative, with the stock maintaining an impressive uptrend since October 2023. Since May 2024, the stock has continued its ascent, albeit with signs of potential consolidation.
Trend Analysis
The long-term uptrend remains intact, characterized by consistently higher highs and higher lows. Since May 2024, the stock has been trading in a tighter range, readying for a potential buildup of energy for the next significant move.
Key Levels to Watch
Immediate Resistance: $141 (multiple tests since May 2024)
Key Support: Lower boundary of the ascending channel (around $130)
Secondary Support: Slingshot SMA (rising green cloud)
Historical Support: $123.50 and $110 (now far below current prices)
Patterns
The most prominent pattern is the ascending channel that has persisted since early 2024. Price action has respected both the upper and lower boundaries of this channel, providing clear areas of support and resistance.
Potential Scenarios
Bullish Breakout: A convincing move above $141 could target the ambitious $395.14 level marked on the chart.
Consolidation: Continued trading between $130 and $141 might occur.
Pullback: A break below the channel's lower boundary could lead to a test of the green cloud support.
Check our 12 hot pick!
12 hot stocks, -80% Extended! Portfolios update. Weekly Stock Pick.
Top 12 HOT Investments. 12 stock amid a backdrop of market anticipation for Federal Reserve interest rate cuts and the growing artificial intelligence sector. Despite recent inflation data forcing adjustments to rate cut expectations, the authors believe there are still attractive investment opportunities across various sectors.
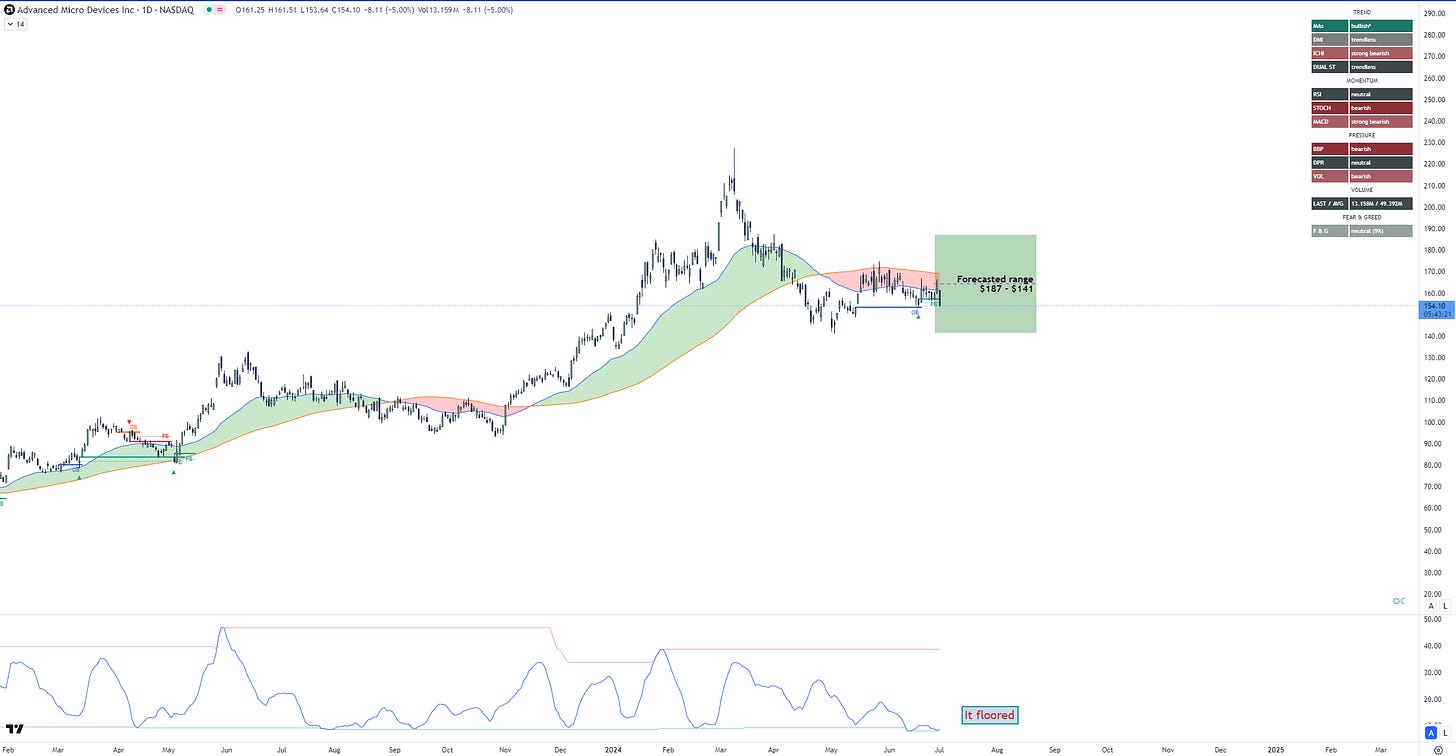
Advanced Micro Devices Inc. (AMD) - NASDAQ
Navigating Consolidation
AMD presents a complex technical picture, with the stock navigating a consolidation phase since May 2024. This comes after a period of significant volatility earlier in the year, including a strong uptrend followed by a sharp correction.
Trend Analysis
The long-term trend for AMD remains bullish, despite the recent consolidation. The stock's trajectory can be broken down into several phases:
Strong Uptrend (Sept 2023 - Feb 2024)
Correction (Feb 2024 - Mar 2024)
Consolidation (Mar 2024 - Present)
Key Levels to Watch
Key Resistance: $165-170 (tested multiple times since May without a clear breakout)
Immediate Support: $140-145 (held firm in recent pullbacks)
Secondary Support: Slingshot SMA (red cloud) major resistance
Historical Support: $120-125 (from earlier in the trend)
Patterns
Several notable patterns are evident:
Ascending Triangle: Formed from October to December 2023, which broke out to the upside.
Double Top: A potential formation in February 2024, which preceded the significant pullback.
Consolidation Rectangle: Current price action is forming a rectangle pattern between roughly $140 and $165.
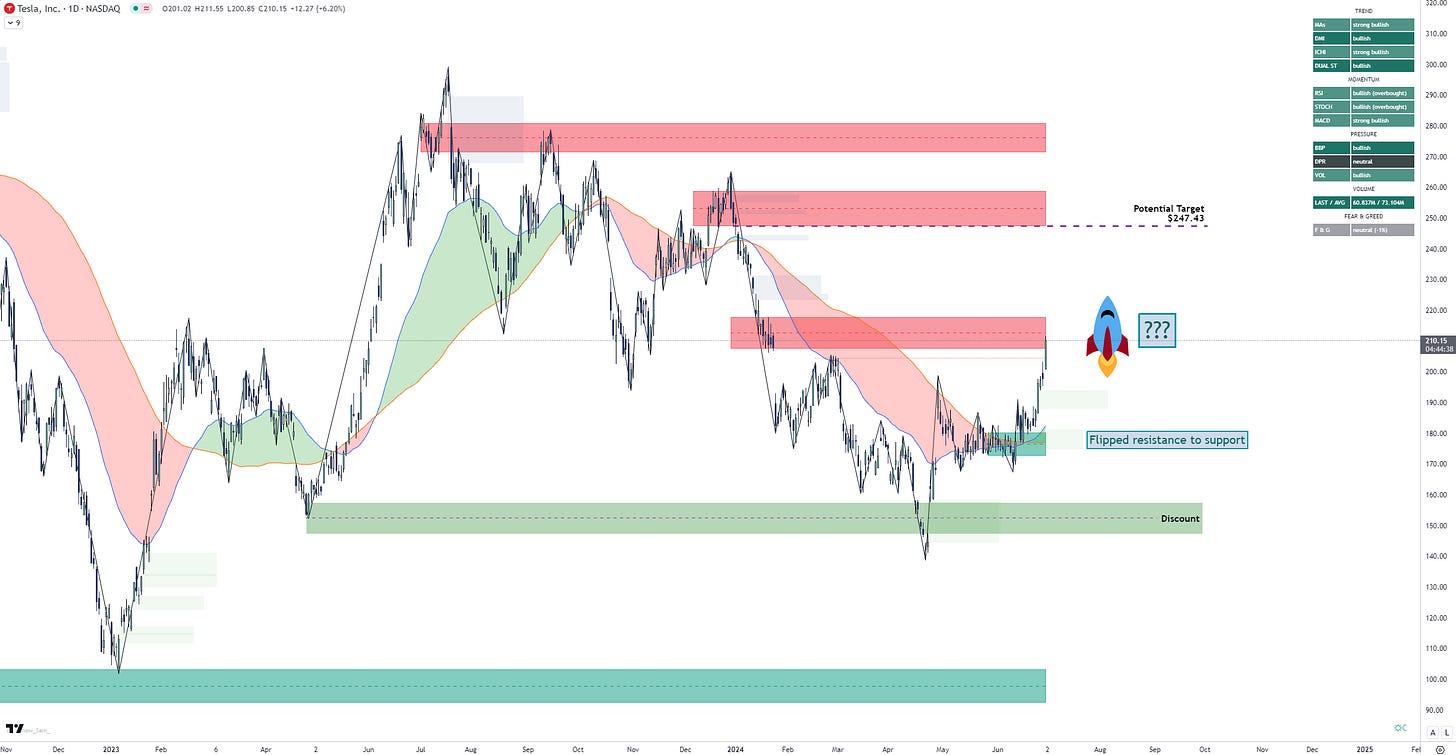
Tesla, Inc. (TSLA) - NASDAQ
Potential Stabilization Emerges
Tesla's chart presents a complex technical picture, with the stock showing signs of potential stabilization since May 2024 after a prolonged downtrend earlier in the year.
Trend Analysis
Tesla's trend can be broken down into several distinct phases:
Bullish Phase (Sept-Dec 2023)
Peak and Reversal (Dec 2023-Jan 2024)
Bearish Phase (Jan 2024-April 2024)
Potential Stabilization (May 2024-Present)
Key Levels to Watch
Key Resistance: $200 (tested but failed to break convincingly since May)
Secondary Resistance: Lower boundary of the green cloud
Immediate Support: $160-170 (held since May, creating a potential double bottom)
Historical Resistance turned Support: $240-250
Patterns
Several notable patterns are evident:
Head and Shoulders Top: Formed from September to December 2023, which preceded the major decline.
Descending Channel: The price traded within this channel from January to April 2024.
Potential Double Bottom: Recent lows around $160-170 could be forming this bullish reversal pattern.
Apple Inc. (AAPL) - NASDAQ
Consolidation Phase Unfolds
Apple's chart presents an intriguing technical picture, with the stock consolidating in a relatively tight range since May 2024. This recent price action comes after a period of significant volatility, including a strong uptrend followed by a sharp correction earlier in the year.
Trend Analysis
Apple's trend can be divided into several distinct phases:
Strong Uptrend (Sept-Dec 2023)
Peak and Reversal (Jan 2024)
Correction Phase (Jan-Mar 2024)
Consolidation (Mar 2024-Present)
Key Levels to Watch
Key Resistance: $195-200 (tested multiple times since May)
Secondary Resistance: The red cloud
Immediate Support: $180-185 (held firm in recent consolidation)
Secondary Support: The green cloud
Historical Resistance: $215-220 (previous all-time highs)
Patterns
Several notable patterns are evident:
Ascending Triangle: Formed from September to December 2023, which broke out to the upside.
Head and Shoulders Top: A potential formation in January 2024, which preceded the significant pullback.
Inverse Head and Shoulders: A possible formation in the recent consolidation phase, if confirmed, could signal a bullish reversal.
This analysis provides a comprehensive overview of these four tech giants. As always, it's crucial to combine this technical view with fundamental analysis and overall market conditions for the most informed trading decisions. Stay tuned for our next newsletter, where we'll continue to bring you the latest insights from the world of finance and technology.
Remember what goes up must come down (eventually)
Stay safe and invest wisely and this is in no mean financial advice.Harry


![[Extended] $10/month until Friday. + Lifetime. Join 25K+ subscribers.](https://substackcdn.com/image/fetch/$s_!rrac!,w_140,h_140,c_fill,f_auto,q_auto:good,fl_progressive:steep,g_auto/https%3A%2F%2Fsubstack-post-media.s3.amazonaws.com%2Fpublic%2Fimages%2Fab599383-a948-455f-b2f6-fea531686d3e_1280x720.png)


